Saturday, March 22, 2014

Topographic Contour Lines


Topographic contour lines of Colorado drawn in a Google Earth satellite image.

Elevation (MSL)
Orange = 5500 ft
Pink = 7500 ft
Purple = 8500 ft
Yellow = 9500 ft
Blue = 10500 ft


For examples of other types of maps please follow this link. 

Saturday, March 15, 2014

Rocks & Soils

IGNEOUS


“Pegmatite is very coarsely crystallized.  Some of the largest crystals in the world have 
been found in pegmatites.  Pegmatites often have the same mineral composition of granites with large crystals of mica and feldspar.  Gem minerals, such as tourmaline and beryl are found in pegmatites.”
 

Pic: Shkatulka pegmatite


Geographic Area of Abundance: Russia


METAMORPHIC

Taken from the following website: http://www.rocksandminerals4u.com/marble.html

“Marble is a metamorphic rock that comes from metamorphosed limestone or dolomite. Limestone is mostly calcite or calcium carbonate, CaCO3. Dolomite CaMg(CO3)2 is related to limestone but is rich in magnesium. Marble has a uniform texture (non-foliated).”

Pic: Gray Marble


Geographic Area of Abundance: China, Italy, United States, India and Greece, among others


SEDIMENTARY

Taken from the following website: http://geology.com/rocks/breccia.shtml

“Breccia is a term most often used for clastic sedimentary rocks that are composed of large angular fragments (over two millimeters in diameter). The spaces between the large angular fragments can be filled with a matrix of smaller particles or a mineral cement that binds the rock together.“

Pic: Chert Breccia


Geographic Area of Abundance: Western Australia


12 SOIL ORDERS OF THE WORLD: found here.

SOIL TEXTURE DIAGRAM

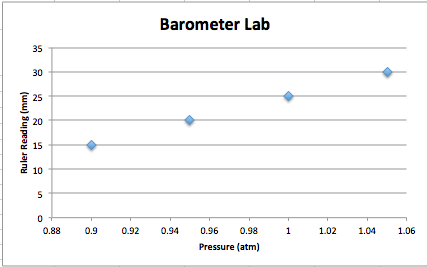
Barometer Lab


Saturday, March 1, 2014

The Life of Ua Jua

This is a blog of the life of a sunflower that I am growing this semester. I will be regularly updating the post the rest of the semester until it's time to plant it. It took one week for the seed to sprout. The sprout started bending towards the sun throughout the day. Once it got too long, it wouldn't stay up. I tied it to a straw for more support.

Day               Height (inches)
1                     0.0
7                     0.5
9                     2.5
11                   4.5
18                   8.0


Thursday, February 13, 2014

Lakes Environmental Windrose Plot Lab

WRPlot Freeware from Lakes Environmental was used in this lab to determine wind patterns at a specified location. For this lab, SCRAM data from the EPA's website was used; specifically data from Wisconsin General Mitchell International Airport in Milwaukee, Wisconsin in the year 1984. Each windrose plot shows the direction the wind is coming from. Google Earth was used to obtain a satellite image of the airport. A windrose plot of the full year was overlaid on the image, (see first image). The other images included below are windrose plots of specific seasons throughout the year as follows: Summer, Fall, Winter, Spring, Year-round.  

Windrose plots allow data to be presented in a way that evaluates changes in wind velocity at a specific station/location. Most of the stronger wind readings were recorded as coming from the Southwest quadrant. In the Spring a majority of the stronger wind readings came from the North/Northeast. 


Summer                                                         Fall 


Winter                                                        Spring 
  

Year-Round 1984


Wednesday, January 29, 2014

Sun Trajectory Lab


Data Recorded for Sun Trajectory Lab- 1/25/14
Time of Day
Length of Shadow (in.)
Height of Pole (in.)
Direction of Shadow
Angle of Sun  (degrees)
7:30 am
22
6.5
West
16.5
9:00 am
6
6.5
Northwest
47
12 noon
0.5
6.5
North
85.5
3:00 pm
7
6.5
Northeast
43
6:00 pm
22
6.5
East
16.5


The purpose of this lab is to determine the trajectory of the sun based on the height of a pole (in this case we used a pencil), the length of its shadow, and the direction the shadow is cast. A pencil was set up on campus and the height was measured. The length of the shadow and its direction were then measured at the times listed in the table above over a 24 hr period. All this data was used to draw the shadow trajectory image above. SunCalc was used as another visual aid to better understand the trajectory of the sun.